Contains affiliate links · Details
The stock market and the OR keep the same hours. Phones stay in the locker or face down, cases run long, and the market opens about when the first patient rolls back. If you want to follow stocks as a clinician, the charting has to happen around your shifts, not during them.
This is the routine I use: a short block of charting on my own time, a written plan, and price alerts that do the watching while I work. It doesn’t make anyone a better trader. It’s a way to make decisions when you’re rested and away from the OR, then leave the market alone until something you planned for actually happens.
I’ve been using TradingView since 2017, and it’s where all of my charting happens.
Key takeaways
- Make trading decisions in a protected block when you’re rested, never during a shift.
- Chart top-down: monthly for the big picture, weekly for the swing, daily for where you’d act.
- Let price alerts do the watching. An alert means “go read your plan,” not “buy now.”
- The free TradingView plan works for learning; its three alerts are the first limit you’ll hit.
Last reviewed Oct 2026 · Written by a practicing CRNA
Why a busy clinician needs a system, not more screen time
Most of us don’t lose money on the market because we lack screen time. We lose it because we make decisions at the wrong moment: tired after a call shift, rushed between cases, or reacting to a headline on the break-room TV.
Three things work against a clinician who wants to follow the market:
- Time. A 12-hour shift plus commute leaves little room in the week. Charting has to fit into a fixed block you can protect, the same way a workout does.
- Decision fatigue. By the end of a long day you’ve made hundreds of clinical decisions. That’s the worst time to decide whether to buy, sell or hold.
- No phone during cases. You can’t watch prices, and you shouldn’t try. Anything that needs your attention in real time is a bad fit for this job.
A system fixes all three. You do the thinking when you’re fresh, write down what would make you act, and let software tell you when price gets there. If no alert fires, you do nothing. That’s the point.
My weekly routine
The routine is built around the week, not the trading day. One longer session sets the plan, and short check-ins keep it current.
| When | How long | What I do |
|---|---|---|
| Friday and Saturday nights into Sunday | Most of my weekly 3 to 4 hours | The big review: my watchlist of US stock indices, gold and silver futures, and individual stocks, especially AI names. Mark levels, update the plan, set alerts |
| Weekday mornings, about 8 to 10 a.m. | 1 to 2 hours | Watch the CME open at 8:30 and the stock market open at 9:30 for a day-trade setup |
| After 10 a.m. if there’s no setup | 0 min at the screen | Walk away. Alerts go to my watch |
| During shifts | 0 min | Nothing. No charts, no orders |
I glance at the market most days, but the real work happens on the weekend. I usually work nights, and I never chart during a shift. On weekday mornings I watch the open: CME opens at 8:30 and the stock market at 9:30. If a setup lines up with my plan by about 10 o’clock, I take it, either in futures or with an options trade. If it doesn’t, I close the laptop and let the alerts take over.
It also means I’m that rare person who looks forward to Monday. Most people dread the start of a new week. For me, Monday’s open is when a weekend of homework finally meets the market.
If you’re coming off a night shift, sleep comes before the market. Lack of sleep leads to bad decisions, and in the market a bad decision costs real money. Our night shift sleep guide covers the drive home and how to protect your daytime sleep.
The exact times matter less than the rule behind them: the plan gets made in a protected block when I’m rested, and the shift itself is off-limits.
Top-down charting: start big, then zoom in
I start every review on the largest timeframe and work down. The bigger chart sets the context; the smaller one only refines the timing. Starting on a 5-minute chart is how you end up reacting to noise.
The charts I use are built on ICT (Inner Circle Trader) models, including the three-candle model. Those models give me the setups; the top-down order below is how I keep them in context.
- Monthly chart: where are we in the big picture? Is price trending up, trending down or stuck in a range? Where are the obvious highs and lows from the last few years? These are the levels everyone else is watching too.
- Weekly chart: what’s the current swing? This is my main working timeframe. I mark the most recent swing high and swing low, and any level price has reacted to more than once.
- Daily chart: where would I act? Only now do I look for the specific price where I’d do something, and the price that would tell me I’m wrong.
- Write it down and set alerts. Each level that matters gets an alert. The written plan says what I’ll do if that alert fires.
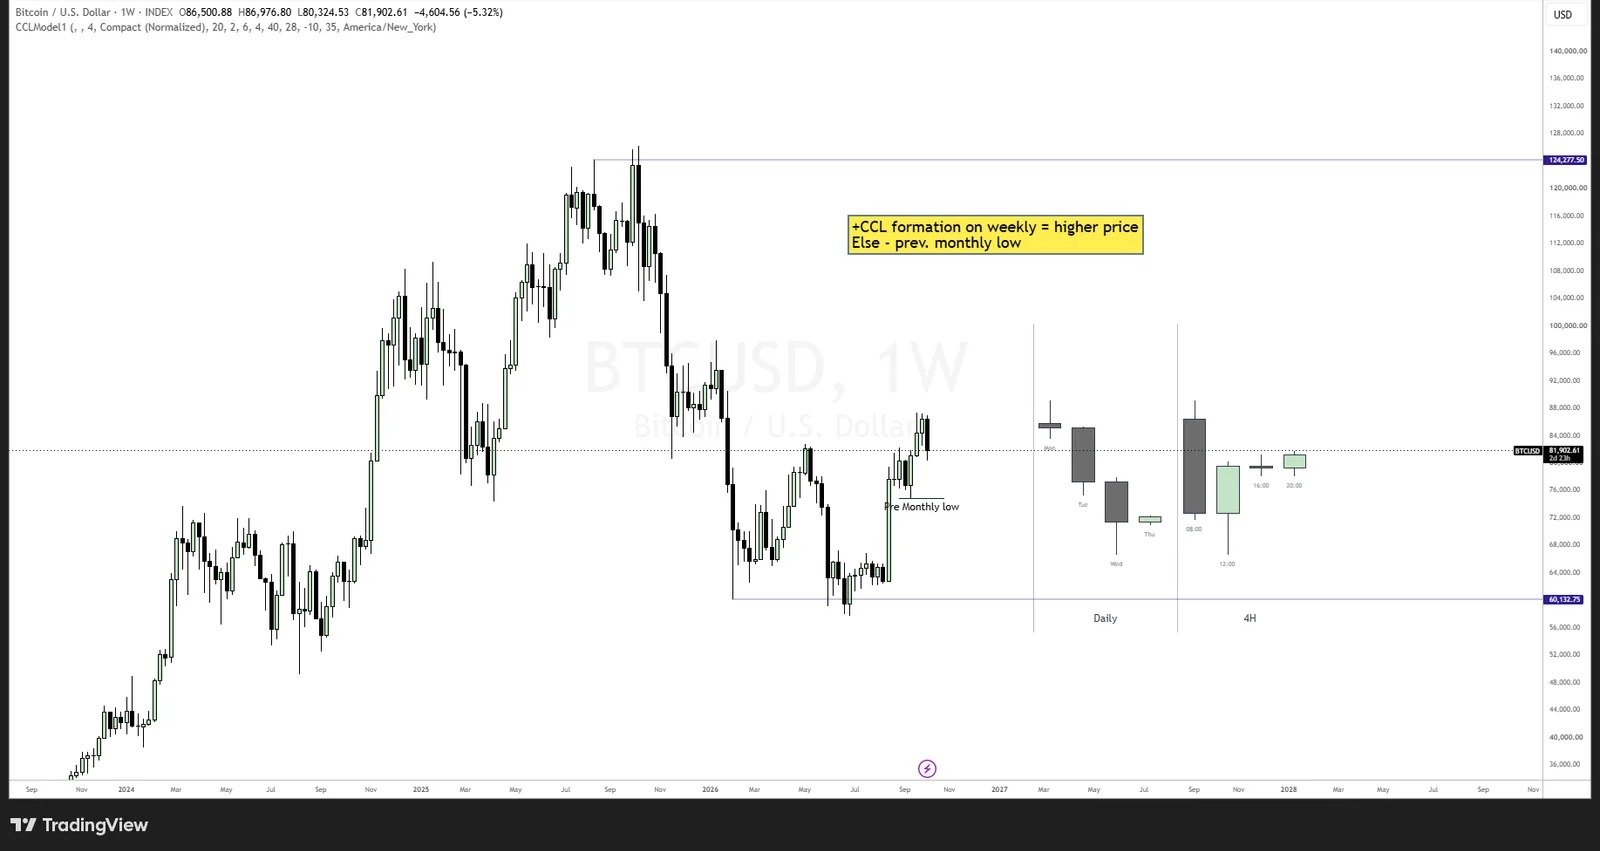
Flipping between different timeframes can be confusing, so I built CCL Model 1 using TradingView. It shows the weekly, daily and 4-hour views side by side on one canvas, and I make my decision from that single screen.
That’s the routine for my long-term positions. Day trading uses the same idea on a smaller scale: I still start with the daily and weekly charts for context, look for the setup on the 30-minute to 1-hour chart, and take the entry on the 5-minute chart. Every timeframe has one job.
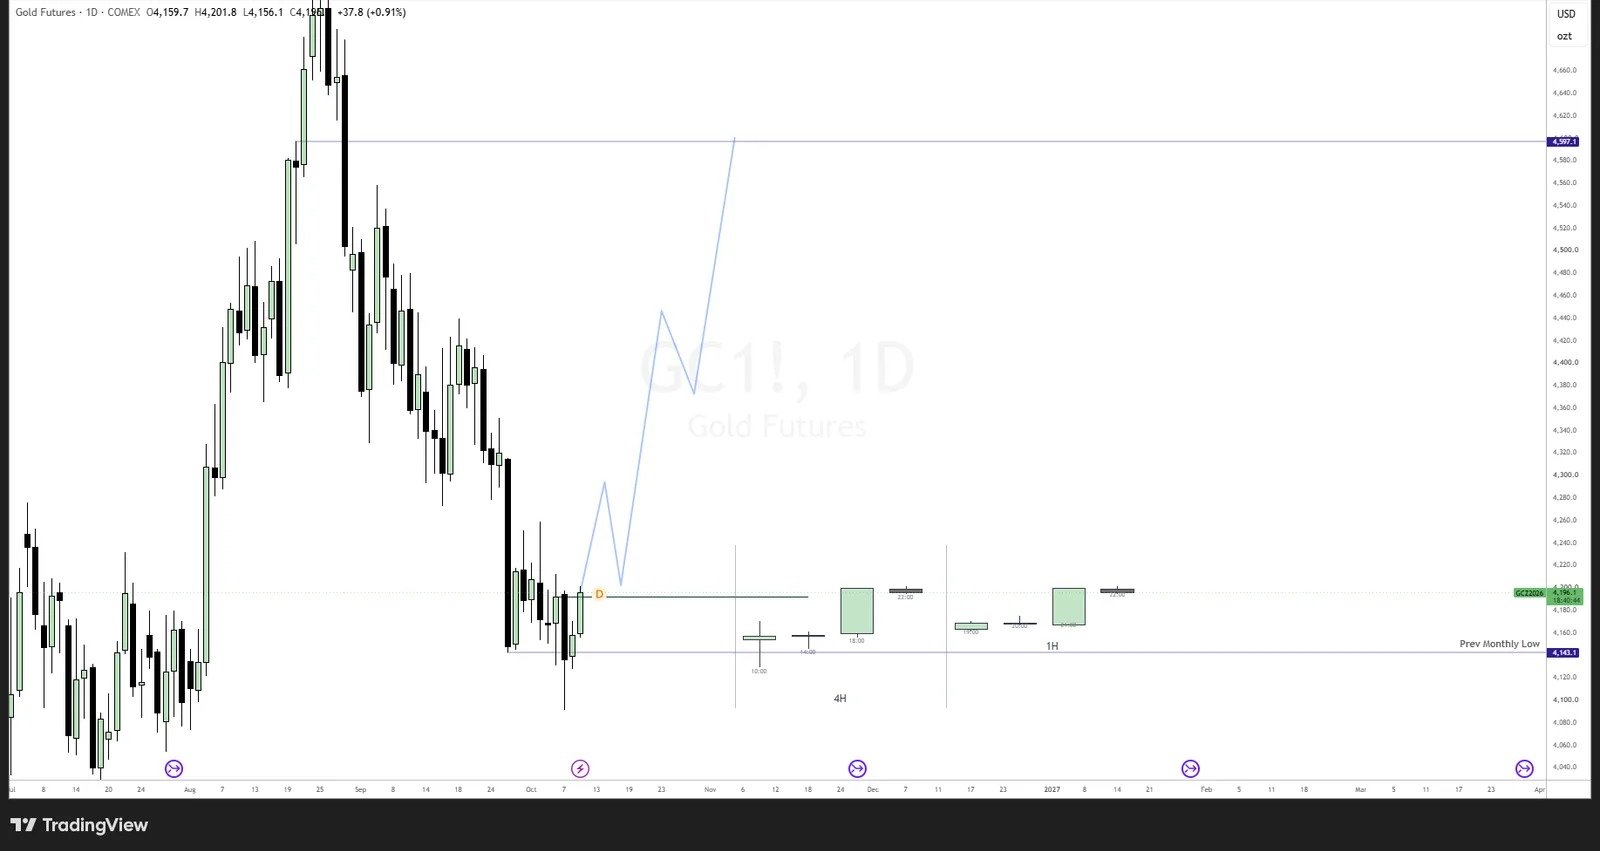
The benefit for a clinician: monthly and weekly charts barely change during a shift. You can review them once a week and be current. Daily charts need a quick look every day or two, which fits a 10-minute morning check.
Let alerts do the watching
Alerts are what make this work on a clinician’s schedule. Once a level is marked, an alert watches it for you, and you don’t need a chart open to know when price gets there.
TradingView alerts run on TradingView’s servers, so they keep working when your laptop is closed and the app isn’t open. When one fires, it can reach you several ways: a push notification from the TradingView mobile app, a pop-up in the browser, an email, a sound, or a webhook for people who automate. (TradingView: About alerts)
Getting alerts on your wrist. I wear a Garmin Fenix 6, and my TradingView alerts show up on it as phone notifications. The watch mirrors notifications from the phone over Bluetooth, so the TradingView app has to be installed and allowed to send notifications. On an iPhone you pick what shows on the watch in the iOS notification settings; on Android you pick it in the Garmin Connect app under Settings > Notifications. (Garmin fēnix 6 manual: Managing notifications) More on the watch itself in The Best Smartwatches for OR Pros.
How I use an alert at work. A buzz on the wrist is information, not an instruction. It tells me a level I planned for has been reached, and it can wait until I’m free to give it my full attention. The alert goes on the list for my next protected review block, where I check it against the plan.
In practice it looks like this: if there’s no setup by 9:30 or 10, I walk away from the computer and wear the watch. Gym, errands, family, it doesn’t matter. When an alert hits, I look at the chart then and decide against the plan I already wrote. During a shift, an alert waits until the case and the shift are over.
Write the alert so it explains itself. TradingView lets you add a message to each alert. Use it. “AAPL weekly low retested: check plan” is far more useful at 2 p.m. after three cases than a bare price.
Watch the expiration. On the Basic, Essential and Plus plans, an alert can stay active for up to two months; Premium and Ultimate allow open-ended alerts. (TradingView: About alerts) Part of my weekly review is renewing anything about to expire.
The TradingView features that matter on a clinician’s schedule
TradingView has hundreds of features. For a routine like this, four matter: price alerts, how many charts you can see at once, how many indicators fit on a chart, and the mobile app. Here’s how the plans compare on those, from TradingView’s pricing page as of October 2026:
| Plan | Price (billed annually) | Active price alerts | Charts per tab | Indicators per chart | Ads |
|---|---|---|---|---|---|
| Basic | Free | 3 | 1 | 2 | Yes |
| Essential | $12.95/mo | 20 | 2 | 5 | No |
| Plus | $29.95/mo | 100 | 4 | 10 | No |
| Premium | $59.95/mo | 400 | 8 | 25 | No |
Source: TradingView pricing. Prices and limits change, so check the page before you sign up. Monthly billing costs more than the annual rate.
If you want to try it, my link takes $15 off your first paid plan: try TradingView (affiliate link).
Is the free plan enough? To learn charting and try the top-down routine, yes. The limit you’ll hit first is alerts: three active price alerts covers about one or two stocks. Once you follow a real watchlist, alerts are the reason to upgrade, not fancy indicators.
What I’d skip at first: more than two or three indicators, second-by-second charts and automated strategies. None of them help a routine built around weekly reviews.
I use a paid plan. With a watchlist that covers indices, metals and a long list of AI stocks, the free plan’s three price alerts wouldn’t last a day.
Rules that keep the job and the trading apart
The patient in front of you always comes first. These rules make sure the market never competes with that.
I keep my rules simple:
- No charts and no orders during a shift. If something can’t wait until the shift is over, it was never part of the plan.
- Decide before the trade, not during it. The entry, the stop and the target are written down before I enter a position. An alert only tells me the moment I planned for has arrived.
- Only take trades with a risk-to-reward of about 1:1.6 to 1:2. If the target isn’t at least 1.6 times the distance to the stop, I pass.
- Keep a journal. Every setup gets written down.
The lesson that took me the longest: stick with what works for you. I tried many different ways of journaling. What stuck was a notebook and a pen. I write down only the specifics: the ticker, what I’m looking for intraday, and what the setup is according to my model. The best system is the one you’ll actually keep using.
Common mistakes busy professionals make
- Indicator overload. Five oscillators that all say the same thing don’t add information. Price, a few marked levels and maybe one moving average are enough for weekly decisions.
- Too many timeframes. Looking at timeframes with no clear purpose produces conflicting opinions. Give each one a job and ignore the rest.
- Checking the phone at work “just once”. It never stays at once. Let the alert decide when you look.
- Treating an alert as a signal to act. An alert means “go read your plan”, not “buy now”.
- Letting alerts expire unnoticed. On most plans alerts end after two months. A level you still care about can go quiet without warning.
- Copying someone else’s trades. A screenshot from social media comes without the other person’s plan, timeframe or risk. You can’t manage a position you didn’t plan.
Rather earn from the market without watching charts? See 7 Passive Income Ideas for CRNAs.
FAQ
Is the free TradingView plan enough to start?
For learning to chart, yes. The main limit is 3 active price alerts, which covers only a stock or two. Most people upgrade once they follow a real watchlist.
Can TradingView alerts show up on a smartwatch?
Yes, as phone notifications. Install the TradingView app, allow its notifications, then allow them on the watch: in iOS notification settings on an iPhone, or in the Garmin Connect app on Android.
Do alerts work when my computer is off?
Yes. Alerts run on TradingView’s servers, not on your device. They need to stay active, so renew any that are about to expire.
How much time does this take each week?
I don’t track it closely, because I enjoy it and lose track of time. My best guess is 3 to 4 hours a week, most of it on Friday and Saturday nights and Sunday.
Should I trade during breaks between cases?
It’s not a great time for it. Breaks are short and your attention is split. Most decisions are better made in a protected review block, when you can look at the chart properly.
Sources
- TradingView: Pricing and plan comparison (checked October 2026)
- TradingView Help Center: About TradingView alerts
- Garmin fēnix 6 Owner’s Manual: Managing notifications
This is educational content about process and tools, not financial advice or a recommendation to buy or sell anything. This post contains affiliate links. If you sign up through them, The Gas Locker may earn a commission at no extra cost to you. This article describes a personal process and the tools I use. It is not financial advice, and nothing here is a recommendation to buy or sell any security. Trading involves risk, including loss of principal. Cover image: AI-generated via Canva. Image credits: Chart: Joaquin G. via TradingView.