Contains affiliate links · Details
Midterm election years have a reputation: choppy for most of the year, then strong into the fourth quarter. It’s one of the most repeated patterns in the four-year presidential cycle.
2018 broke it. The S&P 500 peaked on September 20, 2018, then fell nearly 20% by Christmas Eve. Bitcoin lost another 40%-plus in the same stretch.
2026 is the first midterm year since then whose setup looks like 2018’s. The S&P 500 and Bitcoin have traced similar quarterly shapes. The Fed has turned hawkish late in the year. And the market’s dominant growth story is under public scrutiny. Below is the side-by-side comparison, where it holds up, and where it doesn’t.
Key takeaways
- 2026’s S&P 500 and Bitcoin have traced quarterly shapes much like 2018, the midterm year that broke the strong-Q4 pattern.
- In both years the Fed was tightening into Q4, and AI spending plays the role 2018’s trade war did.
- The comparison has real limits: strong earnings, big-Q2 history and calm volatility argue against a repeat.
- Dates to watch: FOMC Oct 27–28, midterms Nov 3 and FOMC Dec 8–9.
Last reviewed Oct 2026 · Written by a practicing CRNA
Short on time? The two sections that matter most right now:
S&P 500: The 2018 Parallel
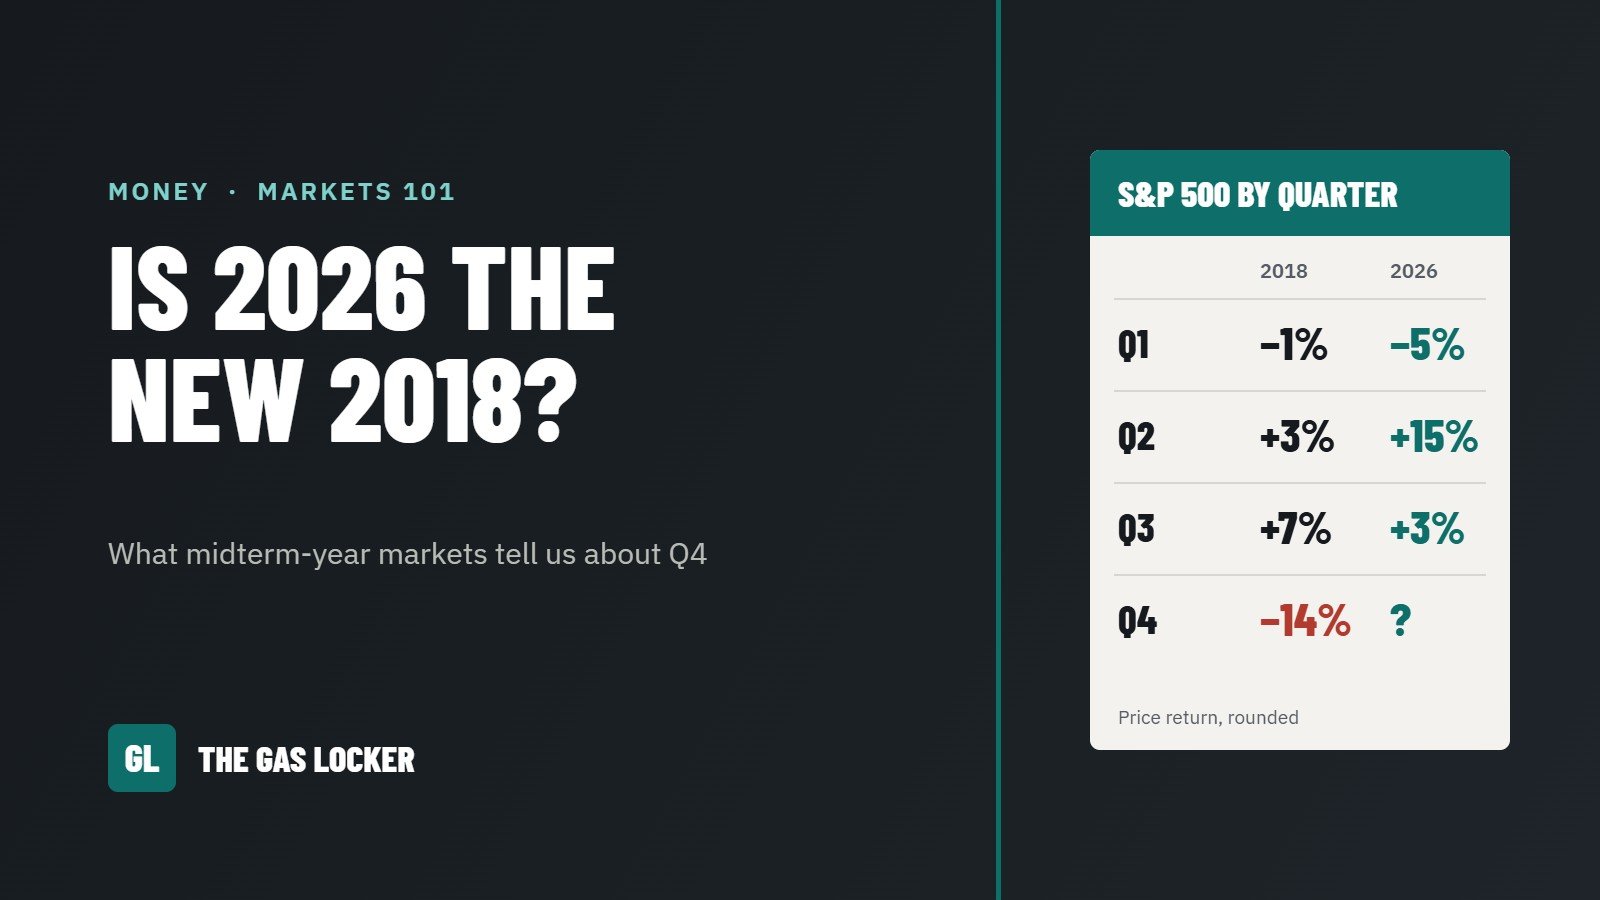
Both years opened with a shock, recovered hard, and reached record highs by late summer. In 2018, a nearly 20% slide followed in Q4.
| S&P 500 (price return) | Q1 | Q2 | Q3 | Q4 |
|---|---|---|---|---|
| 2018 | about -1% | about +3% | about +7% | about -14% |
| 2026 | about -5% | about +15% | about +3% | ? |
2026’s Q1 selloff came from an energy shock tied to the Iran conflict and early doubts about the AI boom. Q2 then delivered a gain of roughly 15%, the S&P’s best quarter since 2020 and the best midterm-year Q2 on record. The index logged 27 record closes by late August, and its latest peak came on August 13. Q3 ended on September 30 with a gain of about 3%, leaving the index about 2% below that high and up roughly 12.5% for the year.
In 2018, the peak came on September 20. October brought a sharp correction, and December a second leg down. The low came on December 24, 2018, about 19.8% below the high, just shy of an official bear market.
What 2018’s top looked like on the weekly chart
The two big US index futures didn’t top together in 2018. The Nasdaq 100 set its high in late August, then only retested it in early October. The S&P 500 kept pushing and printed a slightly higher high in late September. Traders who follow ICT concepts call that split a smart-money divergence (“SMT”). In hindsight, it came just before the Q4 slide.
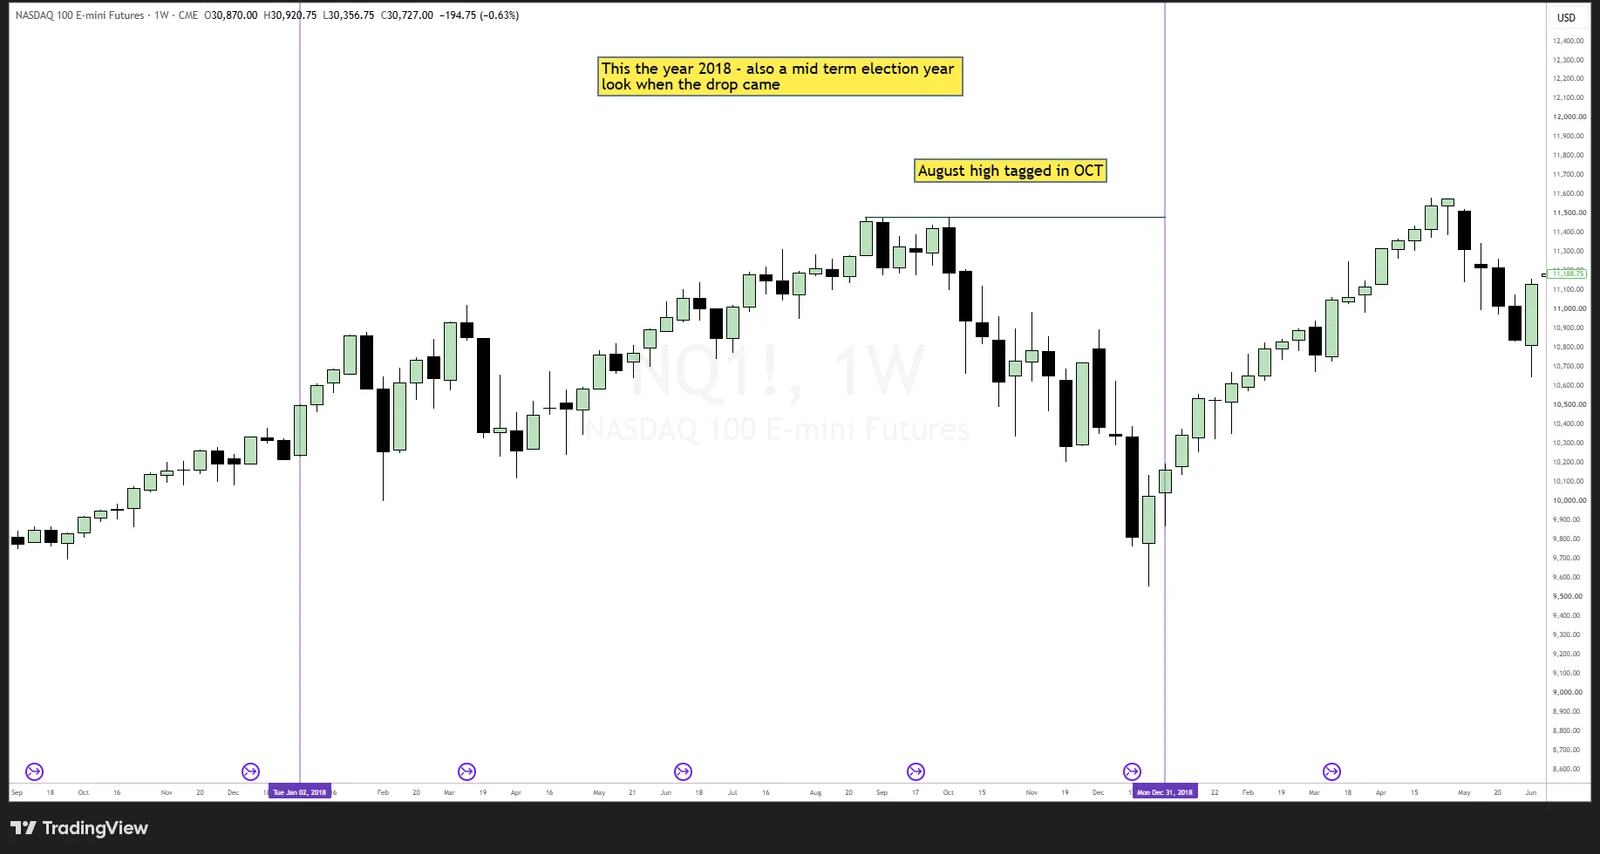
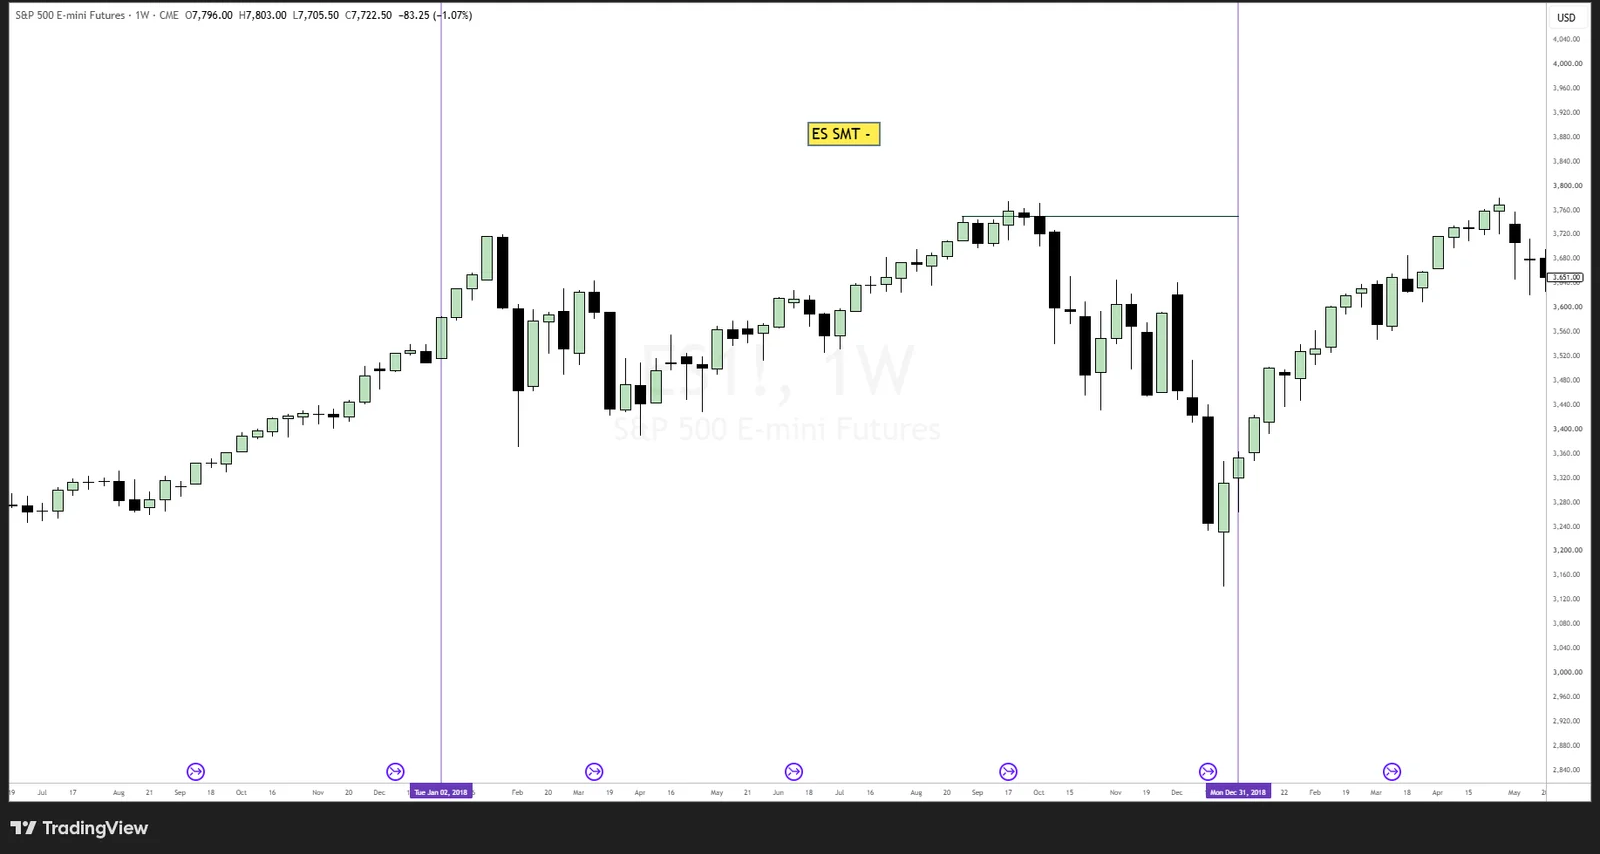
One note on reading these: they’re continuous futures charts, which are adjusted over time, so the price labels on the right side don’t match the actual 2018 index levels. The shape of the moves is what matters here.
I make my own charts on TradingView. New to it? Signing up through that link gets you $15 off your first paid plan (affiliate link).
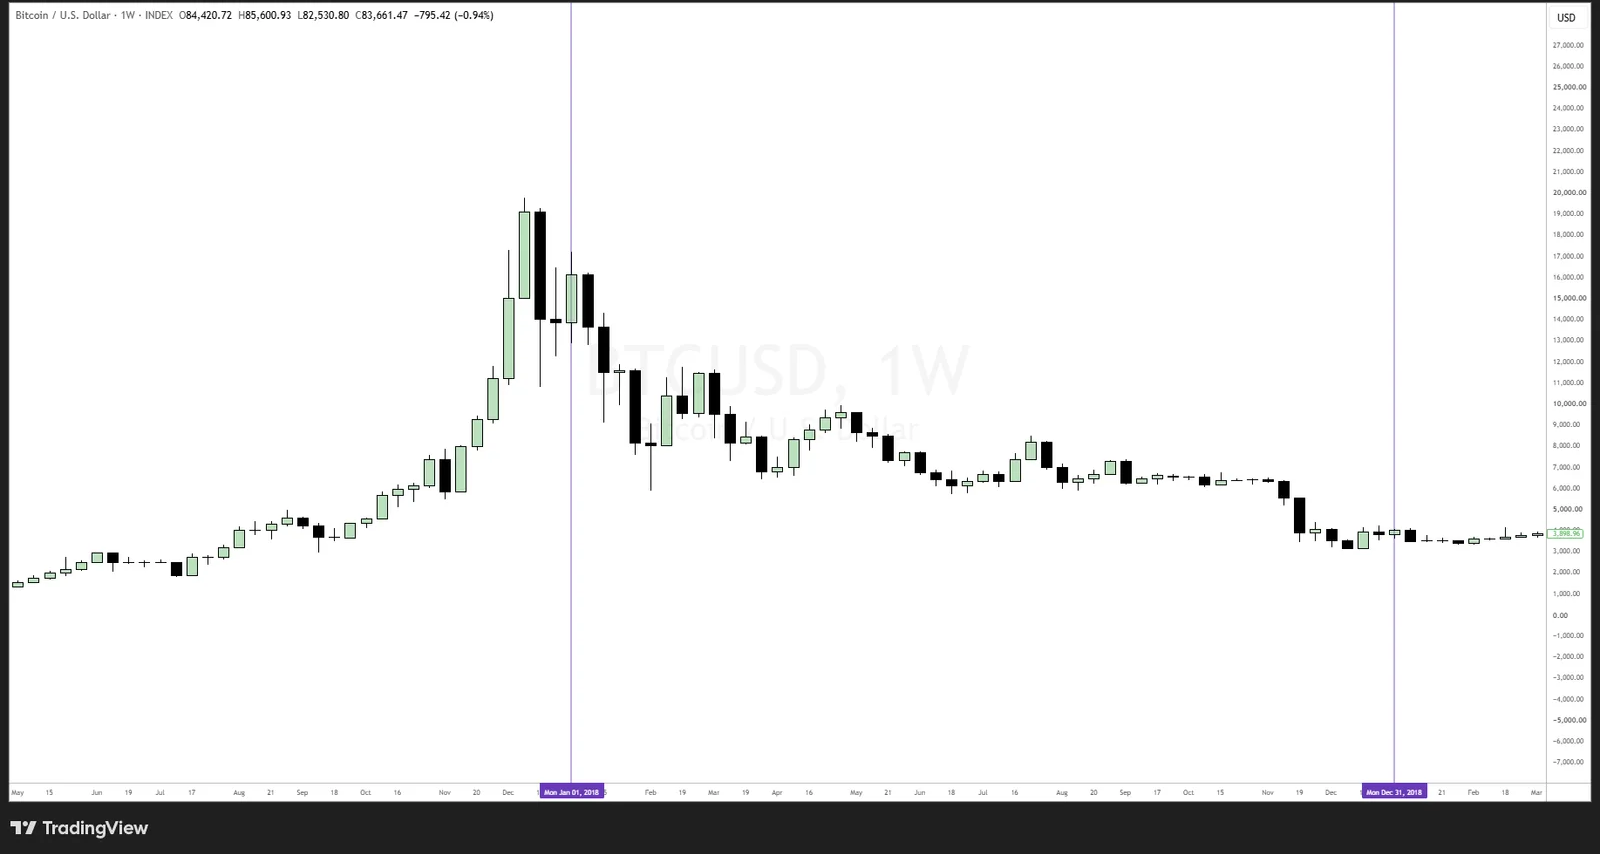
Bitcoin: The Same Down-Down-Up Shape
Bitcoin fell in Q1 and Q2 of 2026, then ripped higher in Q3. Since 2014, the only other year with that down-down-up sequence is 2018.
| Bitcoin | Q1 | Q2 | Q3 | Q4 |
|---|---|---|---|---|
| 2018 | about -50% | about -8% | about +4% | about -42% |
| 2026 | -22.2% | -14.1% | about +40% | ? |
The sequence matches, but the size of the moves doesn’t. 2018’s first-half losses were far deeper, and its Q3 bounce was small. 2026’s Q3 gain of about 40% was Bitcoin’s best third quarter since 2017. Even so, it only just about repaired the first half: Bitcoin ended September still roughly 5% below where it started the year.
In 2018, the modest Q3 bounce gave way to a 40%-plus collapse in Q4, which marked the bottom of that bear market.
The Fed: Hawkish in the Fall, Both Times
In both years, the Fed was tightening as Q4 began, and markets had to reprice what came next.
2018: The Fed hiked four times that year, in March, June, September and December. In early October, Chair Jerome Powell said rates were still a long way from neutral, which markets read as more hikes ahead. The December hike landed in the middle of the selloff.
2026: On September 16, the Fed under Chair Kevin Warsh raised rates by a quarter point to 3.75%-4.00%, its first hike since 2023. Markets entered the year expecting cuts. By March, they had started pricing in hikes, so the move itself was expected. The drivers were inflation that has run above target for five years, a resilient job market, and oil above $100 a barrel with the Strait of Hormuz disrupted. The Fed’s own projections point to one more hike before year-end, and 10-year Treasury yields are near 20-year highs.
The difference: 2018 was a steady, pre-announced hiking cycle. 2026 is a turn from cuts back to hikes after years of stubborn inflation. The shared mechanism is tighter money heading into Q4 while stocks sit near record valuations.
AI Capex: 2026’s Version of the Trade War
In 2018, the escalating US-China trade war put the year’s growth story in doubt. In 2026, the question mark sits over AI infrastructure spending.
The big cloud companies are on track to spend roughly $670 billion on AI chips and data centers this year. Much of that money moves in a loop. Nvidia invests in AI labs and cloud providers, and they spend it on Nvidia chips. OpenAI alone has committed more than $1 trillion to compute vendors through 2035, including Oracle, Microsoft, Nvidia, AMD and CoreWeave.
OpenAI’s revenue is growing fast, to an estimated $40 billion annualized run rate by mid-2026, double its end-of-2025 level. But that’s still a fraction of the spending being built on the expectation of future demand. Markets have already shown how sensitive they are to this. When reports surfaced in July that Nvidia might guarantee up to $250 billion of OpenAI data center financing, Nvidia shares fell about 4.5% intraday.
Like the 2018 trade war, this isn’t a crisis. It’s a live source of doubt about the story driving the market, one that could amplify a Fed-driven pullback if sentiment turns.
Read this before drawing conclusions
Where the Comparison Breaks Down
Pattern matches are easy to overfit. These are the biggest differences:
- Earnings are strong, but that’s not a shield. S&P 500 earnings are expected to grow around 24% in 2026. But 2018 also had 20%-plus earnings growth, helped by that year’s tax cut, and still sold off in Q4. Valuations matter too, and the S&P ended Q2 near 27.5 times trailing earnings.
- Big Q2s have usually been followed by strength. In the nine prior years when the S&P 500 gained 10% or more in Q2, Q4 was never lower.
- Bitcoin’s setup is different. 2018 was deep in a bear market after the 2017 bubble. 2026’s Q3 rally was broad, with Ethereum posting its best third quarter ever.
- Volatility isn’t at extremes. The VIX closed at 14.87 on September 25, below its long-run average of about 19 but near its 10-year norm. Calm, but not unusual.
- Small samples mislead. One matching year out of a handful of midterms is a pattern, not a law.
Mark your calendar
Q4 2026: Dates to Watch
The 2018 selloff unfolded between early October and Christmas Eve. These are the 2026 events landing in that same window:
- September 30 (done): Q3 closed. The S&P 500 finished the quarter up about 3% and Bitcoin up about 40%
- Mid-October: Q3 earnings season begins, including AI spending guidance from the big cloud companies
- October 27-28: FOMC meeting
- November 3: Midterm elections
- December 8-9: FOMC meeting, with the Fed’s projections pointing to one more hike this year
- December 31: Year-end, when the 2018 comparison gets its answer
Looking for income beyond trading the market? See 7 Passive Income Ideas for CRNAs.
FAQ
Does the market usually rise in Q4 of a midterm year?
Historically, yes. The stretch from a midterm year’s fall into the following spring has been one of the strongest in the four-year cycle. 2018 is the notable exception.
Does this mean a Q4 2026 crash is coming?
No. This is a historical comparison, not a forecast. 2026 shares several features with 2018, but it also differs in important ways, and most midterm years ended strong.
Why compare Bitcoin and stocks together?
Both trade as risk assets and react to the same forces, especially interest rates and liquidity. When both show the same quarterly shape as one specific past year, that’s worth noting. It still isn’t proof.
Why do the 2018 numbers say “about”?
Quarterly returns vary slightly by source, depending on closing prices and whether dividends are included. The shape of each year matters more here than the decimals.
Sources
- CNN: What Kevin Warsh said about the Fed’s first rate hike since 2023 (Sept. 16, 2026)
- NPR: The Fed raises interest rates for the first time in over three years
- iShares: Fed Outlook 2026
- Advisor Perspectives: S&P 500 Snapshot (record close Aug. 13, 2026)
- Motley Fool: The S&P 500 Has Hit 27 Record Highs in 2026
- Chevy Chase Trust: Second Quarter 2026 (Q2 return, valuation)
- TheStreet: Stock market today, June 30, 2026 (Q2 close: 7,449.36)
- CP24 / AP: Wall Street on Sept. 30, 2026 (Q3 close: 7,651.54)
- Flashpoint Financial: Stocks Soar in the Second Quarter
- FinanceFeeds: Bitcoin Q3 2026 quarterly return (CoinGlass data)
- FXStreet: Bitcoin wraps up strong Q3 (Sept. 30, 2026)
- Portfolio Terminal: VIX daily closes
- Sacra: OpenAI revenue estimates
- Fortune: OpenAI data center deal with Nvidia
- Yahoo Finance: The record-setting S&P 500 by the numbers (hyperscaler capex)
2018 quarterly figures are approximate historical values. 2026 figures are based on closing prices through September 30, 2026.
This article is educational market history, not financial advice. It compares past price patterns and makes no prediction, trade call or recommendation. Past performance does not guarantee future results. This post contains affiliate links. If you sign up through them, The Gas Locker may earn a commission at no extra cost to you. The Gas Locker is not a registered investment advisor. This article is for education and entertainment only and is not financial, investment or tax advice. Nothing here is a recommendation to buy or sell any security or digital asset. Markets involve risk, including loss of principal. Image credits: Chart: Joaquin G. via TradingView.