
Tools / Three Candle Model
Three Candle Model
A charting tool for TradingView
It marks the three-candle setups on your chart, reads the bias from the monthly down, and pings your phone when it’s time to look.
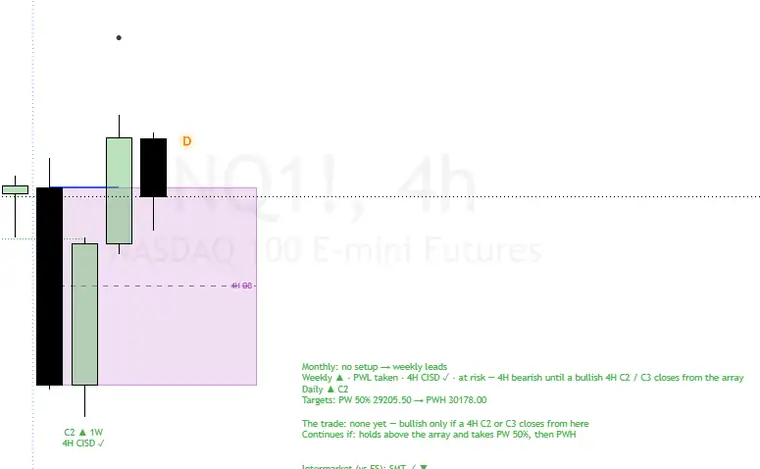 Real chart
How it works
Find it, read it, get the alert
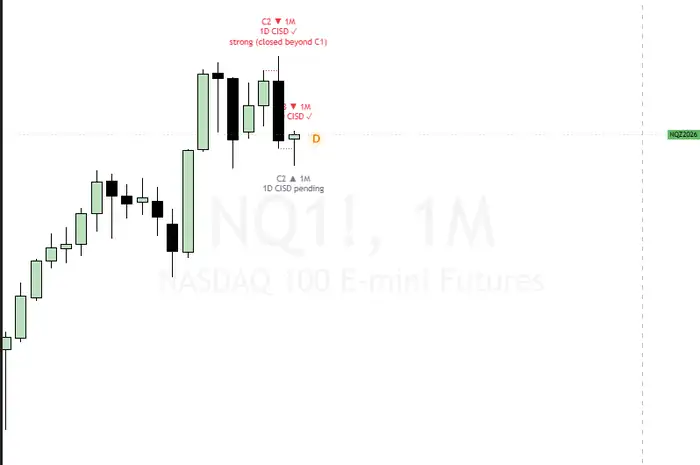
Candles labeled for you
The model labels candle 2 and candle 3 of each setup and checks the lower timeframe for a change in state of delivery (CISD).
- C2 and C3 labels with the timeframe they belong to
- CISD confirmed ✓, pending, or failed ✗
- The array shaded so you can see where price should react
Top-down, in plain words
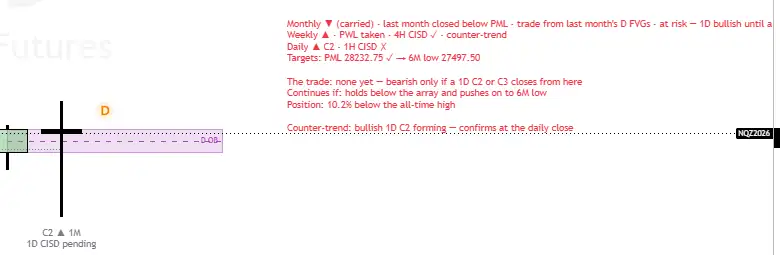
A short readout on the chart says where each timeframe stands and what has to happen next.
- Monthly, weekly, daily bias, with what’s at risk
- Targets, like the previous week’s 50% and high
- The trade: none yet, or what has to close first
- Intermarket: SMT check against a related market
Know when to look
TradingView alerts tell you when a setup confirms, when price reaches a target, and when a candle closes that matters. No staring at charts all day.
- Bias confirmed (previous high taken plus CISD)
- Price entered a gap or array to watch
- Target reached, with the level
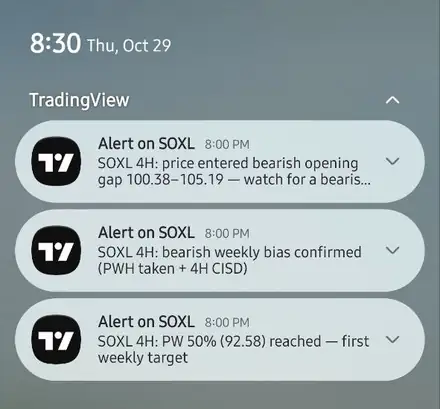
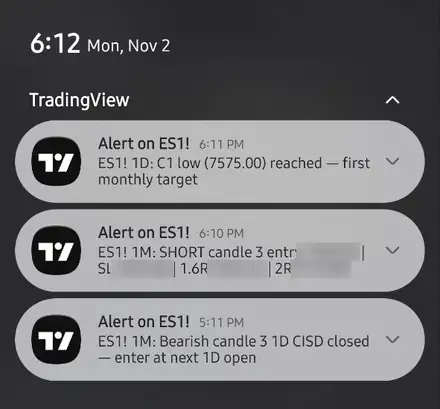
Real alerts. Trade prices hidden.
From monthly down
The same rules run on the monthly, weekly, daily and 4-hour charts, so the big picture and the entry tell one story.
- Monthly C2 here, flagged strong because it closed beyond C1
- Same labels and readout on every timeframe
Under the hood
Built line by line
3,000+ lines of Pine Script, written by a working CRNA for his own trading. Every label, readout and alert on this page comes from that code.
- Runs inside TradingView, on the chart you already use
- Same rules on every market and timeframe
- Still being refined trade by trade
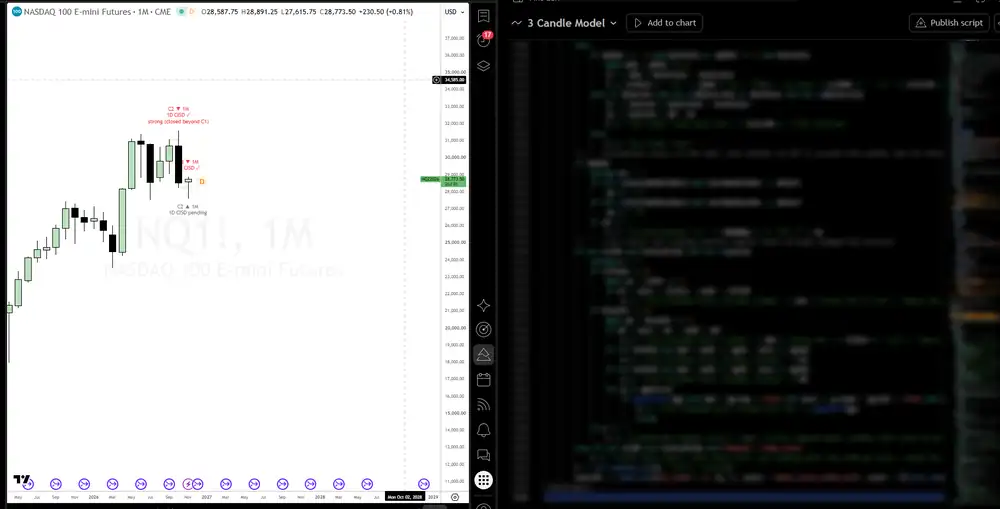 Code blurred
Quick glossary
What the labels mean
Waitlist
Get it first
Join the waitlist and we’ll email you when the Three Candle Model goes live on TradingView.
Only Three Candle Model updates. Unsubscribe anytime.
An educational charting tool, not financial advice or a recommendation to buy or sell any security. Trading involves risk, including loss of money. Real charts and alerts shown for illustration; trade prices hidden. Requires a TradingView account. TradingView is a trademark of its owner.